
In much of Greater Houston, rain is a minor inconvenience. In Northeast Houston and Baytown, even routine rain can be debilitating. Flooded streets, damaged homes, and constant uncertainty are common. These patterns reflect long-standing infrastructure gaps and planning decisions. As a result, this model has left some communities bearing a disproportionate share of flood risk and environmental harm.
Project Overview
From 2023 to 2025, Bayou City Waterkeeper partnered with Stanford University. The goal was to better understand how community members experience flooding and evaluate nature-based solutions (NBS), also known as green stormwater infrastructure (GSI).
Through surveys and focus groups in Northeast Houston and Baytown, two of our Water Justice Zones, we developed a public, accessible tool. It translates residents’ lived experiences into clear, defensible data.
Learn more by visiting our Nature-Based Flooding Solutions StoryMap.
The dashboard highlights the benefits of green stormwater infrastructure. It also shows the barriers that shape how these solutions are implemented.
It is designed for residents, organizers, and advocates. It supports people who want to speak at public meetings, submit public comments, and advocate for stronger flood planning and wetland protection.
This work builds on BCWK’s long-term commitment to community-centered approaches. Residents were not just surveyed. They helped shape research questions, shared expertise about their neighborhoods, and guided how results were interpreted. Community researchers from Northeast Houston and Baytown also worked alongside BCWK and Stanford staff to deploy the survey, connect with neighbors, and ensure the process remained accessible, respectful, and grounded in local relationships.


Why We Started This Project
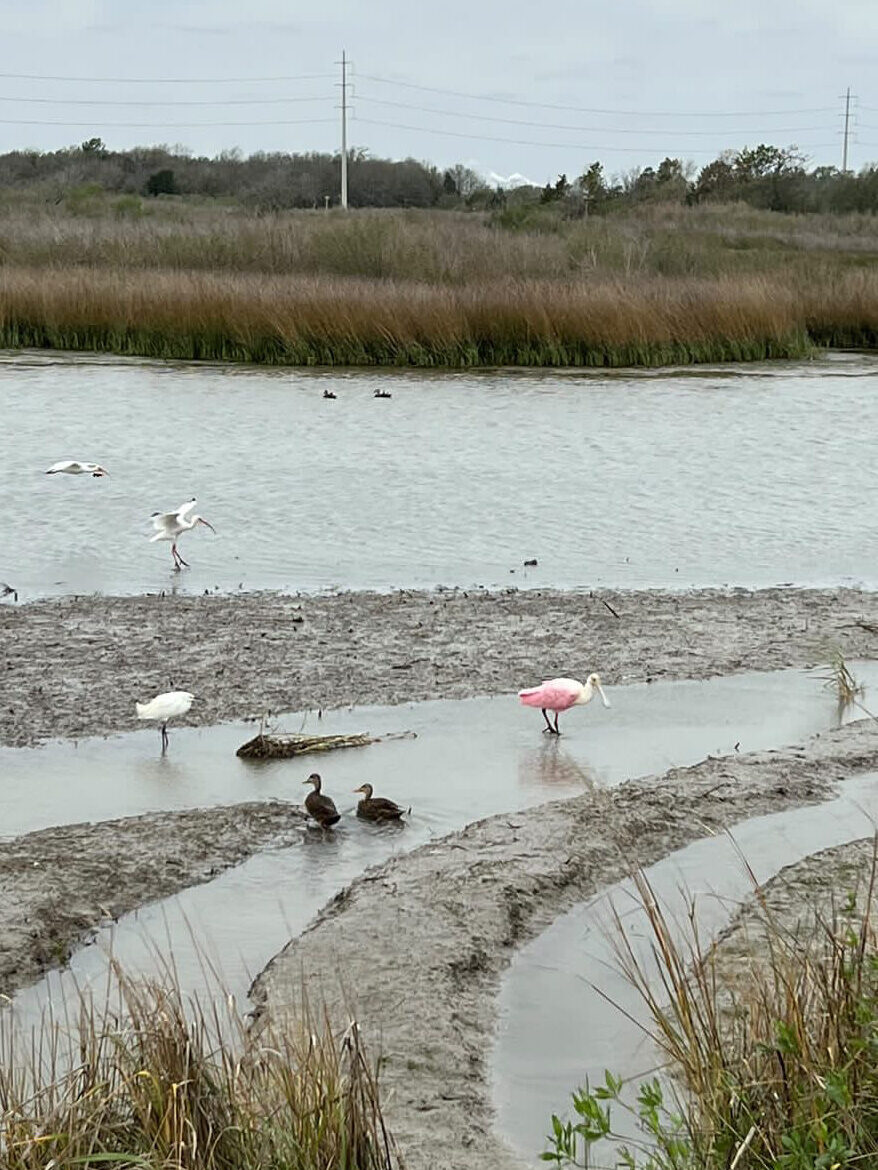
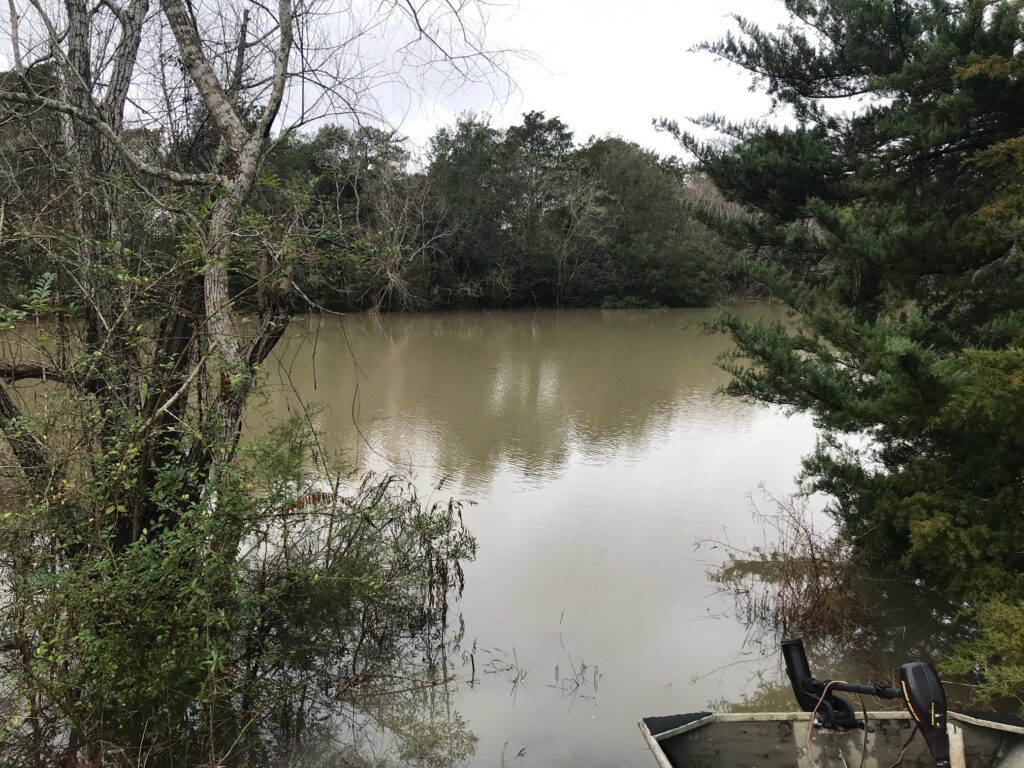
For decades, Houston has relied on “gray” stormwater infrastructure such as pipes, concrete channels, and drainage systems. While essential, these systems cannot replace natural systems. Wetlands and prairies provide essential ecosystem services. For example, they absorb water, slow runoff, and reduce flood impacts.
Visit our Wetland Watch Hub to learn about wetlands in your area
However, in Northeast Houston and Baytown, these impacts are not evenly shared. Both communities sit downstream of major watersheds and have experienced decades of disinvestment and environmental burden.
Repeated flooding, industrial contamination, and slow disaster recovery have reshaped how residents in Northeast Houston relate to their homes and neighborhoods. In Baytown, industrial development, land subsidence, and aging drainage systems have increased flood risk and strained critical infrastructure.
Additionally, these conditions also contribute to high rates of sanitary sewer overflows (SSOs). During heavy rain, sewer systems can become overwhelmed, sending untreated sewage into streets and waterways.
Identify documented sewer overflows through our Justice in the Sewers Mapper
Both communities are designated Water Justice Zones due to long-standing infrastructure inequities.
Starting with Community Voices
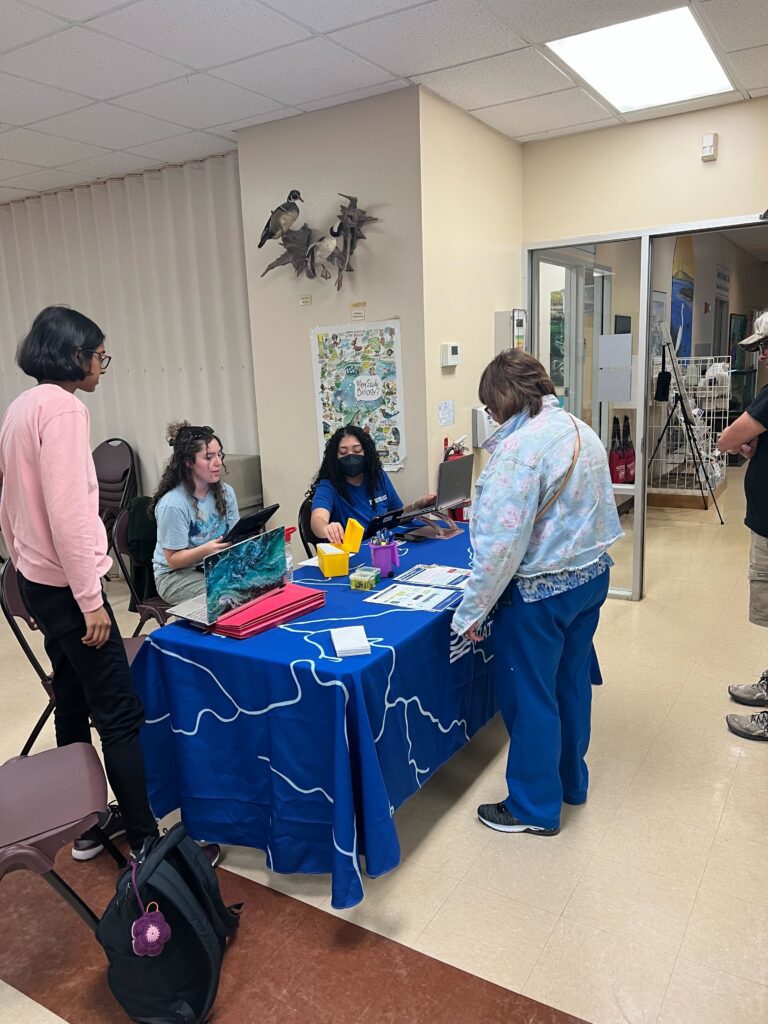
BCWK worked with local partners to bring residents together in Northeast Houston and Baytown for focus groups. We hosted sessions in both English and Spanish, with interpretation, stipends, and logistical support to reduce barriers to participation.
These conversations shaped the survey questions and helped prioritize key themes. The survey reflects what residents identified as most important. This process translated lived experiences into structured data that can be used in public decision-making.

This work formed the basis of BCWK and Stanford’s peer-reviewed research on community perceptions of green stormwater infrastructure (GSI).
Read the full publication here Evaluating perceptions of green stormwater infrastructure (GSI) through a community-based participatory research (CBPR) approach
Turning Community Knowledge into Survey Data
Building on the focus group findings, BCWK and Stanford developed a bilingual survey in English and Spanish to document how residents in Northeast Houston and Baytown understand and evaluate nature-based solutions.
The survey examined perceived benefits of green stormwater infrastructure, concerns about implementation, and barriers that shape how these projects move forward.
Community researchers supported survey deployment, helping distribute it through trusted networks and increasing participation among residents often underrepresented in infrastructure planning.
By prioritizing in-person outreach, bilingual access, and relationship-based engagement, this work addressed common gaps in traditional planning processes and aligned with BCWK’s community-centered approach.
This work also informed ongoing academic research on participatory methods, demonstrating how community-driven survey design can strengthen representation, improve data quality, and increase the usefulness of findings.


Sharing Results Back with the Community
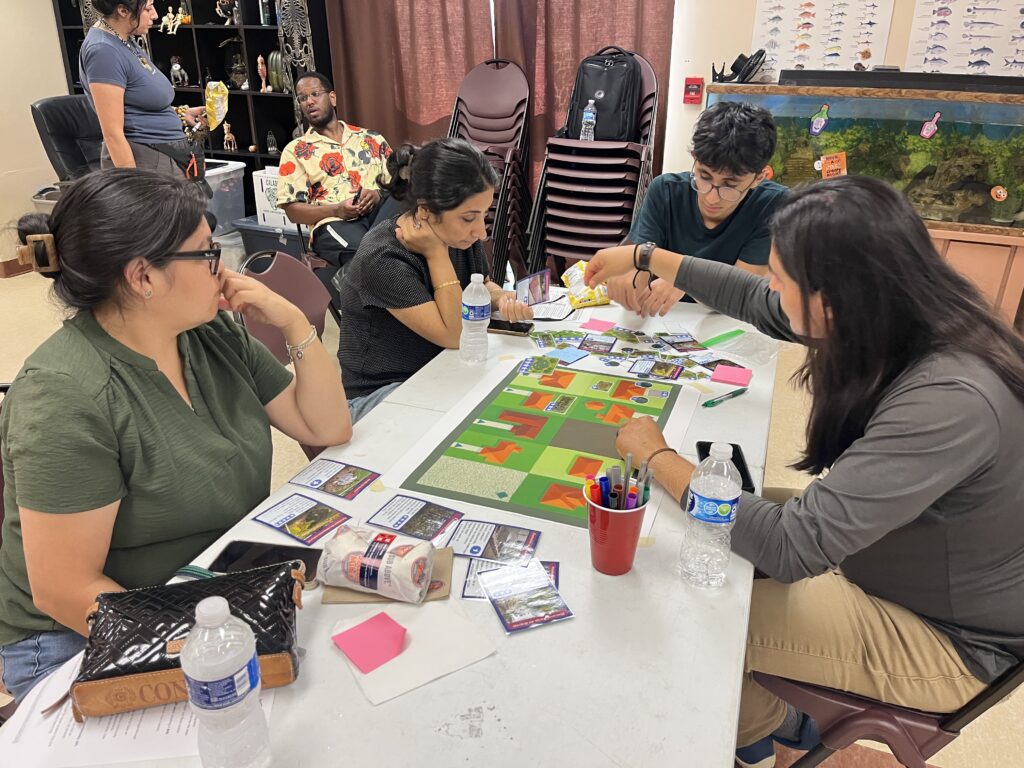
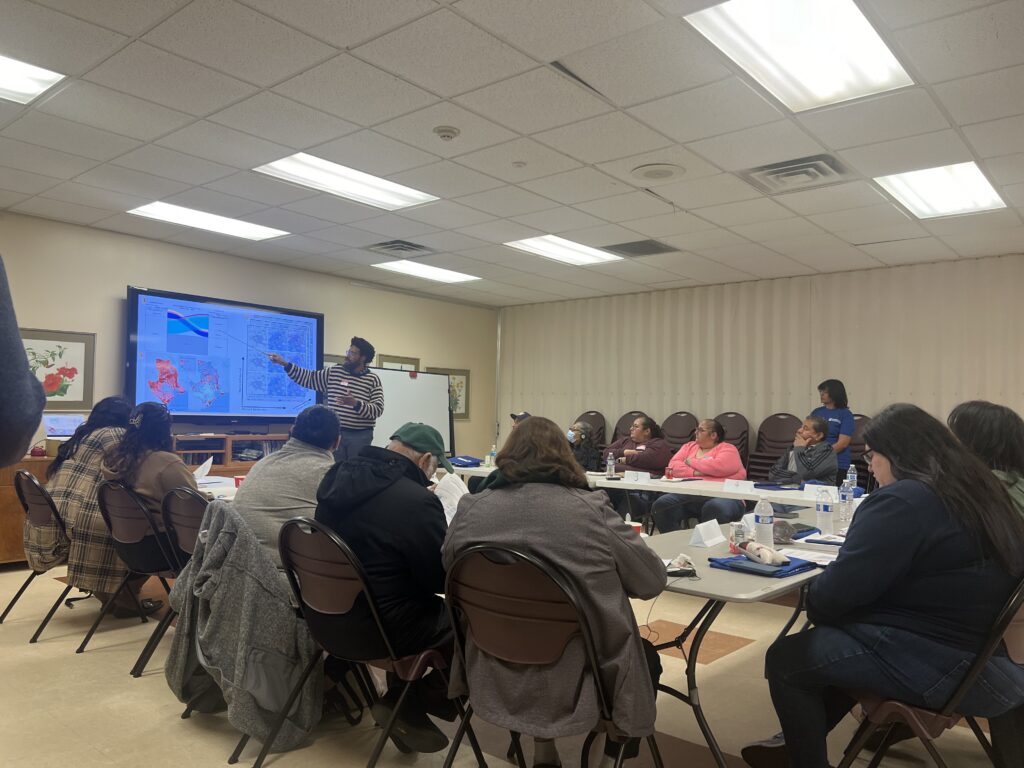
After the survey was completed, BCWK and Stanford hosted two community workshops in Northeast Houston and Baytown to share findings directly with residents and gather feedback.
Participants reviewed results, discussed impacts, and identified priorities such as utility interruptions, anxiety during rain events, property damage, and high repair costs. Many also highlighted barriers including cost, lack of information, and maintenance concerns.
Workshops included hands-on activities where residents prioritized rain gardens, bioswales, and other green infrastructure solutions, and shared ideas for how these projects could work in their neighborhoods.
Exploring the Dashboard
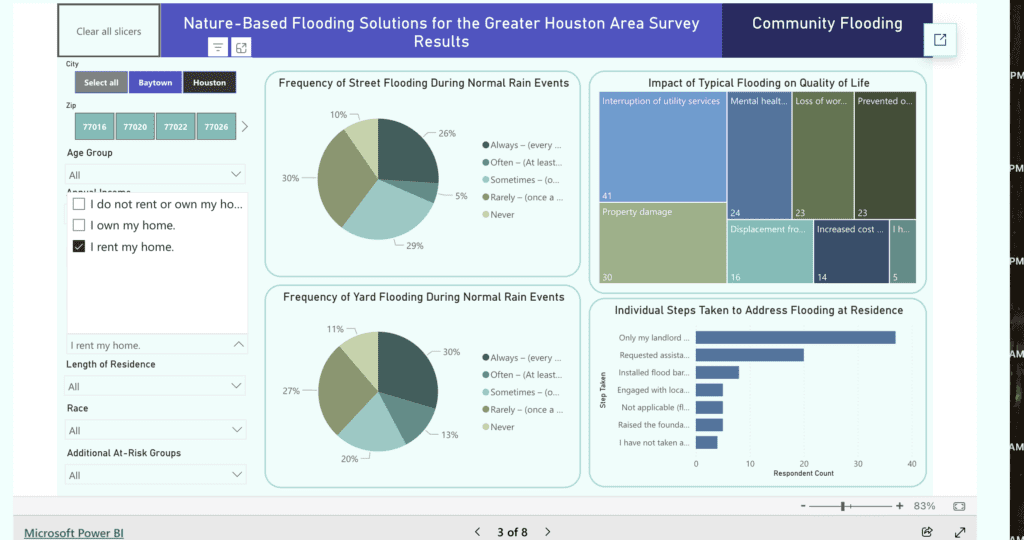
The Nature-Based Flooding Solutions Dashboard brings together survey results on flooding experiences, drainage conditions, quality of life impacts, and views on green stormwater infrastructure in Northeast Houston and Baytown.
Users can explore these findings through NBS Dashboard,including how often residents experience flooding during routine rain events and how those impacts vary by housing status, age, and neighborhood.
Explore the Nature-Based Flooding Solutions Dashboard
For example, in Baytown, the dashboard shows that many residents report frequent street and yard flooding during routine rain events. When filtered by housing status, the data also shows that renters and homeowners experience different impacts. Renters report high levels of service interruptions, mental health stress, and displacement concerns. Homeowners more frequently report property damage and high repair costs. These patterns help explain how flooding affects households in different ways and why one-size-fits-all solutions often fall short.
In many cases, the dashboard shows the personal steps residents take to address flooding, including requesting assistance, installing barriers, or relying on landlords. In many cases, residents report limited ability to make permanent improvements. This is especially true in rental housing. The data supports the claims made by community members, and highlights the structural barriers to resilience.
All of this information is publicly available. It does not require specialized software, logins, or institutional access. This makes the data accessible to residents, community organizations, and advocates.
Understanding Community Priorities
In Northeast Houston, the dashboard reveals how preferences and concerns about green stormwater infrastructure vary across age groups and neighborhoods. Users can filter the data to see how residents of different ages view small, mid, and large-scale nature-based solutions and what barriers they perceive.
For example, when filtering for residents ages 45 to 64 in Northeast Houston, the dashboard shows strong support for rain gardens, rainwater harvesting, and urban forestry, alongside concerns about maintenance costs and lack of information. Among residents ages 25 to 44, the data shows similar interest in small- and mid-scale solutions, combined with worries about installation costs, long-term upkeep, and whether projects will be implemented equitably.
Across age groups, many residents identify increased taxes, high installation costs, and limited education about green infrastructure as major barriers. These findings help explain why support for nature-based solutions can coexist with hesitation about how they will be paid for, maintained, and governed.
By allowing users to compare neighborhoods, age groups, housing status, and other factors, the dashboard makes it possible to see how community priorities and constraints differ within and across communities.
Using the Dashboard to Advance Equitable Nature-Based Solutions
The Nature-Based Flooding Solutions Dashboard was created to support action. Residents, organizers, and partners can use this tool to strengthen funding requests, support public comments, challenge harmful development, and advocate for wetland protection and green stormwater infrastructure.
When residents attend a city council meeting, planning hearing, or flood control district meeting, they can reference specific data showing how often flooding occurs in their area, how it affects housing stability and daily life, and what types of nature-based solutions their neighbors support. When submitting comments on development proposals or stormwater permits, advocates can cite documented patterns from hundreds of survey responses rather than relying only on individual testimony.
The dashboard also helps clarify where barriers exist, including concerns about cost, maintenance, taxes, and equitable implementation. This information is critical for shaping projects that are not only technically effective, but socially responsive.
We encourage residents, organizers, and partners to explore the dashboard, share it within their networks, and bring it into conversations about drainage investment, land use, green infrastructure, and wetland protection. Use it to inform public comments, community meetings, funding proposals, and policy discussions. This tool exists to support collective advocacy for nature-based solutions that are effective, equitable, and grounded in community priorities.
Community voices are now documented and visible in planning spaces. We urge decision-makers to engage with these findings and ensure that future infrastructure investments reflect the realities and priorities shown here.